Aerial Photogrammetry to Assess Crop Health
We seek to deliver cost effective results for farmers, vineyard and golf courses owners. We can map hundreds of acres quickly and accurately for general crop monitoring and farm planning using aerial NDVI and RGB cameras.
This technology enables our clients to assess the health of crops over time by analysing high resolution aerial maps highlighting problem areas. You will be surprised at how affordable the service is and the ROI benefits you get back from the investment.
Drone mapping technology is becoming a standard for farmers, vineyards & golf courses and helps to spot threats quickly and easily, so you can:
Save time and quickly spot the effects of disease, pests etc
Monitor impact of treatments and test over time
Step 1.
Map the area using an Aerial Camera
Using photogrammetry software, an area is determined in which an automated flight route is set and the UAV will take several hundred or thousand geo-referenced images.
Step 2.
Convert images into a map of the area
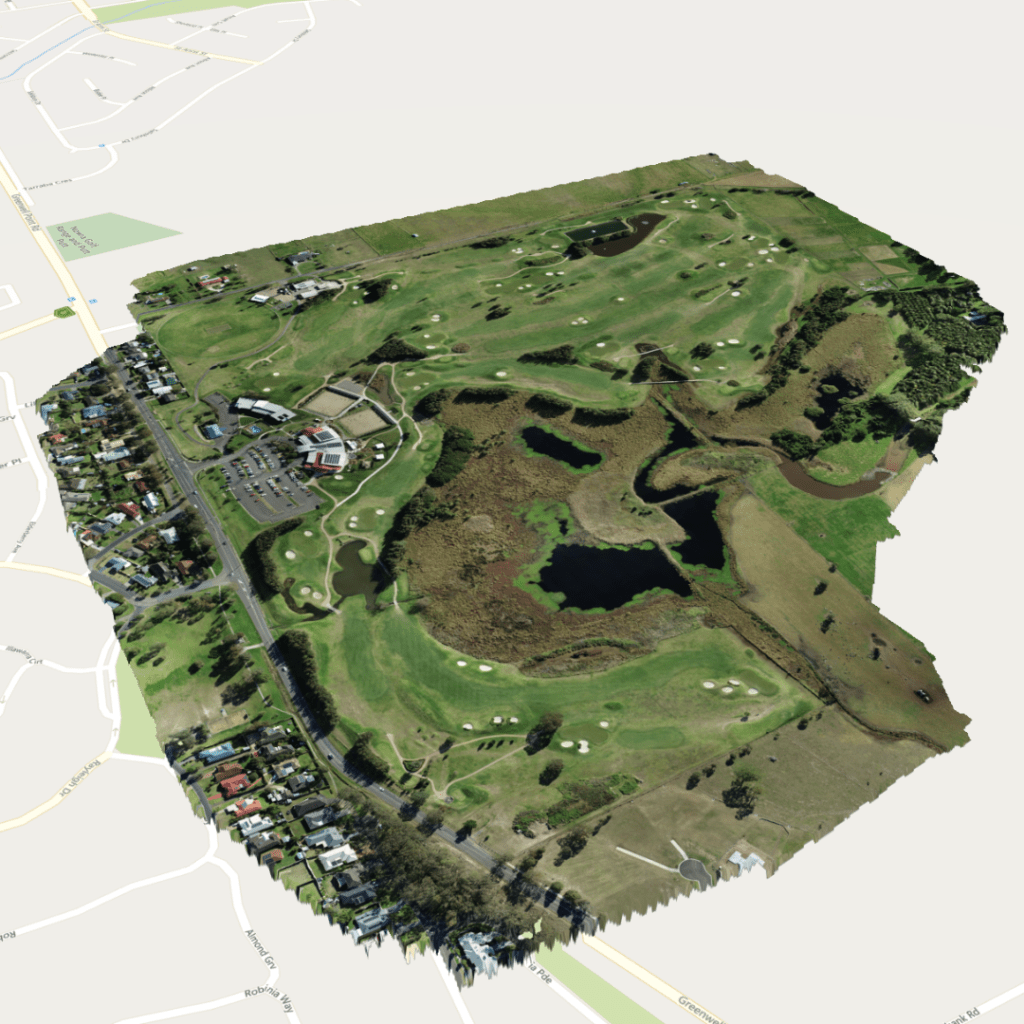
The geo-referenced images of the area are then uploaded to an online program which uses a super-computer to stitch it all together. The final result provides incredible resolution of the course and also offers a birds eye 3D interactive map view of the area.
Step 3.
Analyse Data and Determine Problem Areas
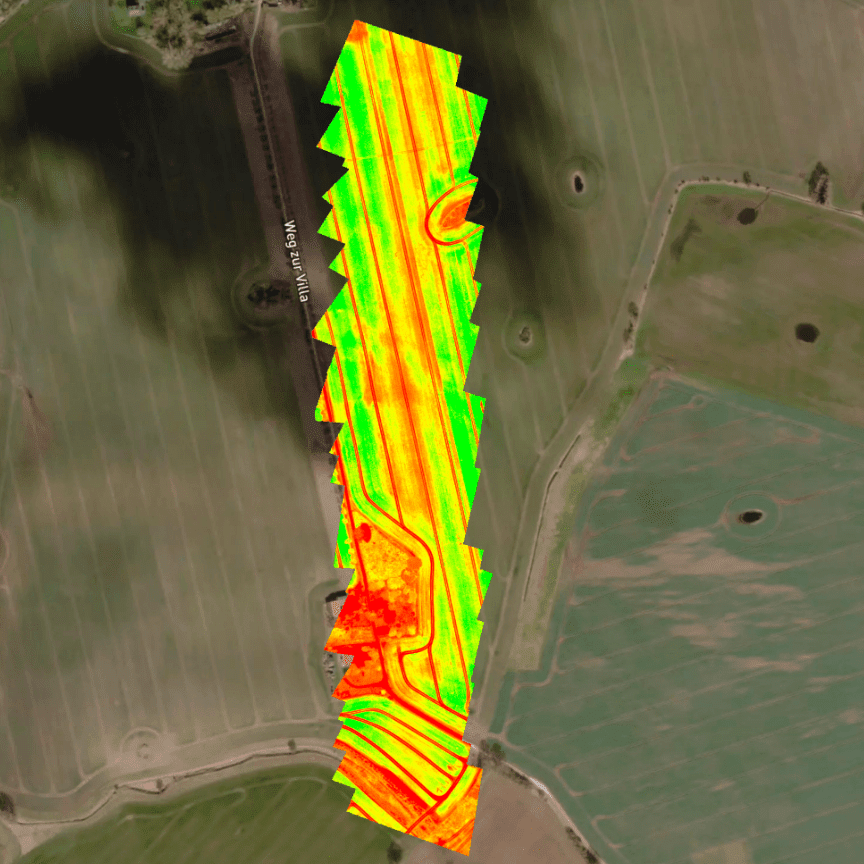
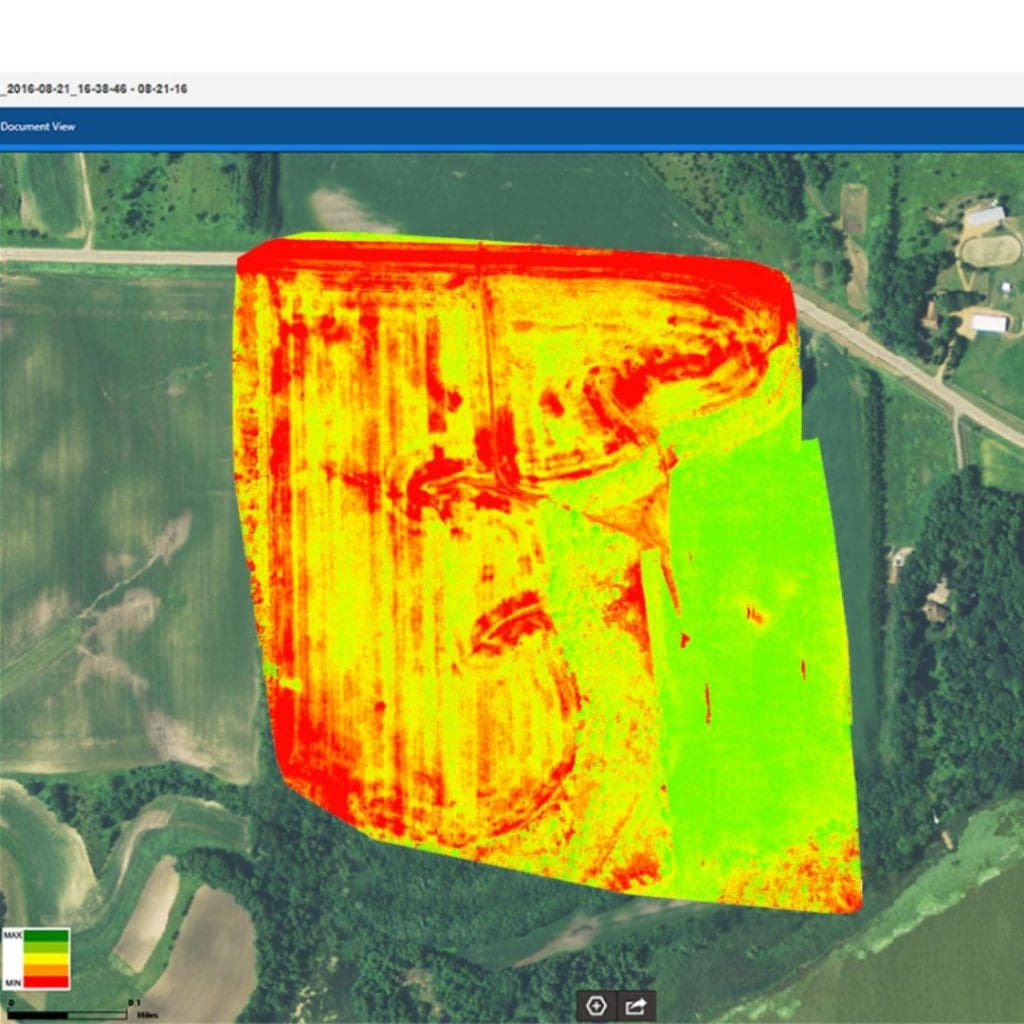
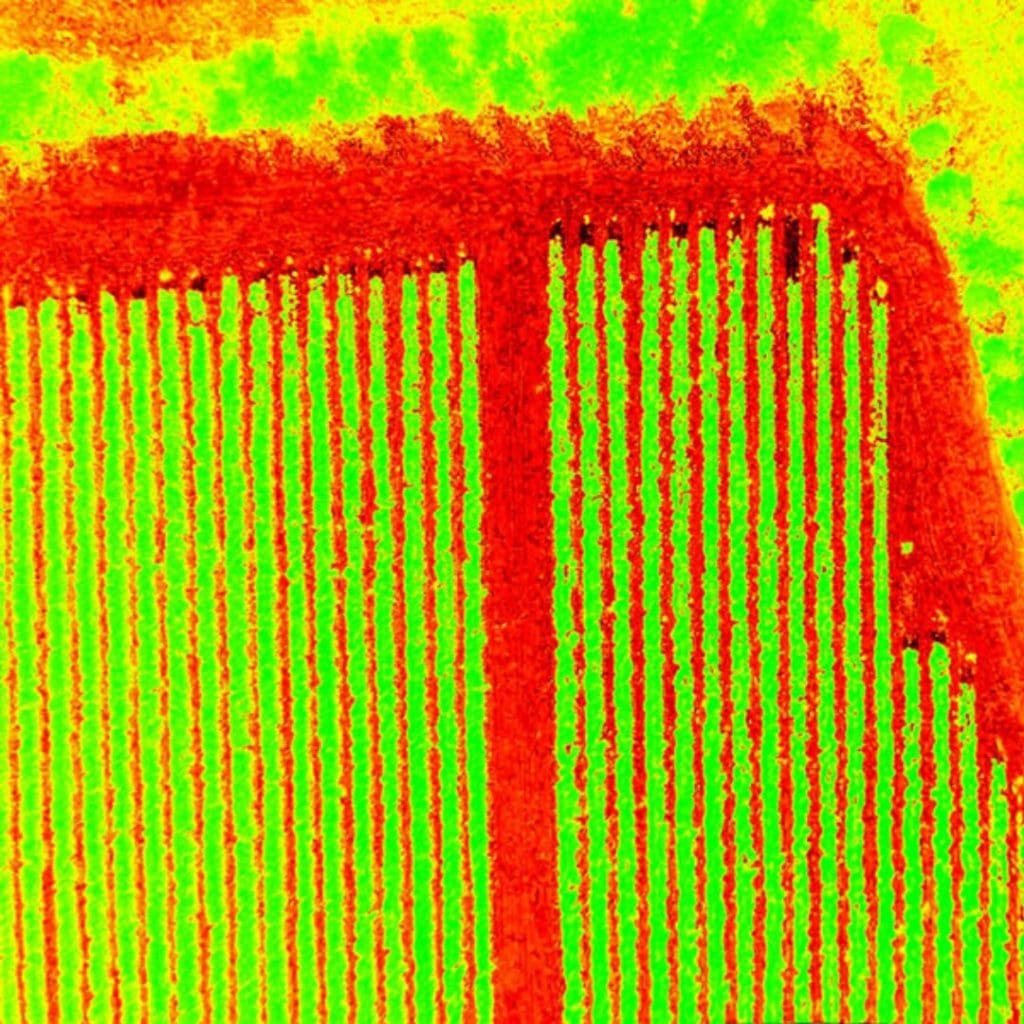
once the client has access to the map they can look at the plant health map and easily determine the problem areas by viewing the vegetation index. This uses a formula to convert the real colours to false colours to clearly highlight the differentiation between healthy and unhealthy areas.
Step 4.
Action the insights
Physically go out to the problem areas and determine what the issue is. Whether it’s over-watering, pests, drainage issues, weeds, wrong chemicals used etc. Implement corrective measures to fix the issues and take notes of the action taken in each problem location.
Step 5.
Monitor Periodically
Repeating the process allows the client to refer back to the notes and determine if the actions taken are working or if a new solution needs to be implemented. Tracking progress over time and making changes accordingly will see an increase in the crop/turf health and save money on unnecessary resources.
Other Benefits
GPS referenced map of the surveyed area. This allows you to take measurements of length, area and also volume of materials. Also able to make notes on the map plant health map which shows colour spectrum highlighting problem areas.
3D model of the area
Elevation map showing contours of the area which may highlight drainage issues
save money on products by only applying chemicals, pesticides etc to the areas that need them most
increase health of crops by fixing problem areas quickly and therefore increasing the yield save time by spending less working hours on the areas that do not need as much attention, rather than using a blanket method of maintaining crop health.
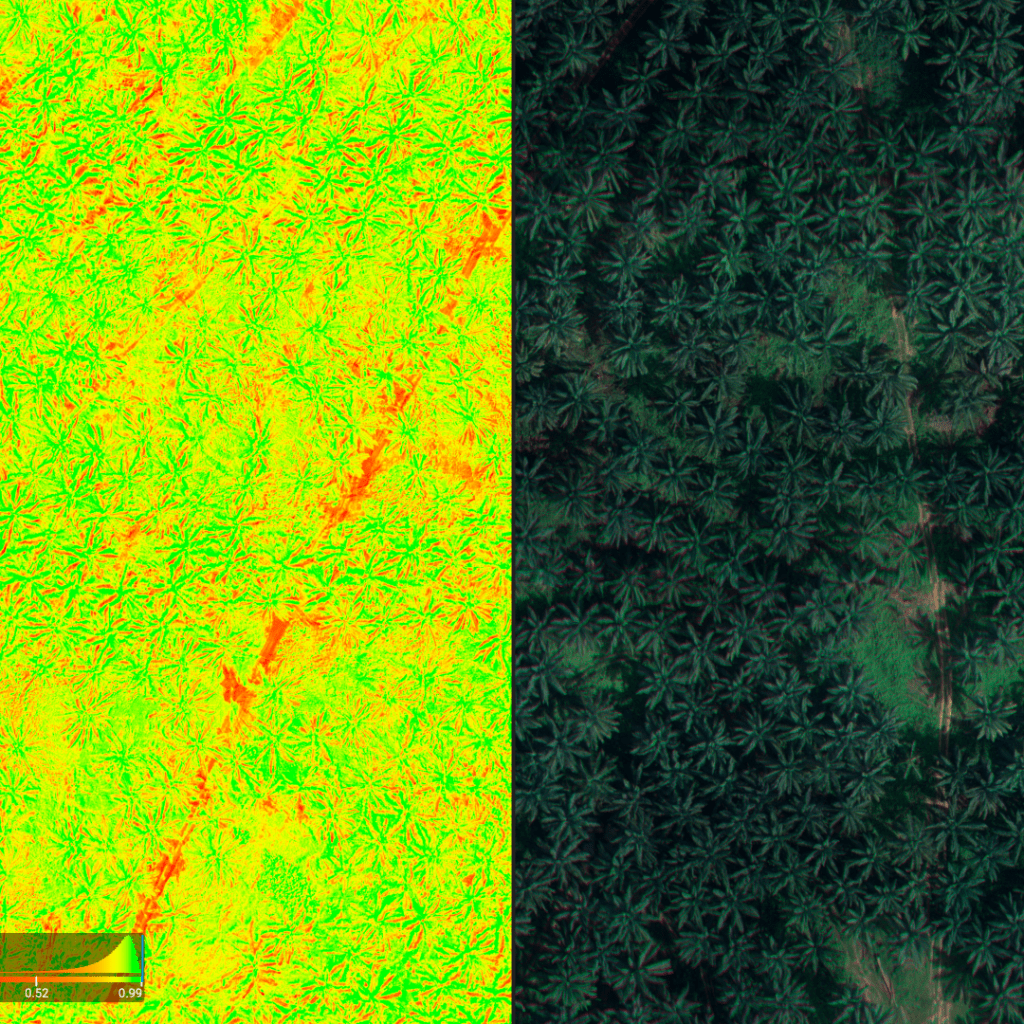
Normalised Difference Vegetation Index is used widely in agriculture and on golf courses. This is achieved using a special camera to measure the amount of infra red light being reflected from the crops/turf. Green light reflects 5-10 times LESS light back than unhealthy plants/turf. This means that unhealthy areas can easily be identified on an NDVI map. This enables maintenance staff to have the data that can identify health issues long before they are visible to the naked eye (and often while there is still a good chance to correct them cost-effectively). The maps clearly show areas of stress in the turf by the red and yellow areas. Then the maintenance staff are able to use this information to go out to these areas and determine what the issue may be in order to correct the it before it gets worse.
Red Green Blue cameras are the regular cameras that everyday photographers use. They block the near infra red light from getting through. While we can still use these to determine crop health of crops/turf it is not as effective in determining unhealthy areas as early as NDVI cameras would. This is because the differentiation in colour between healthy and unhealthy areas is more subtle than NDVI imagery.
Image Gallery